File:Marginalcostcurveasshortrunsupplycurve.png
No higher resolution available.
Marginalcostcurveasshortrunsupplycurve.png (360 × 201 pixels, file size: 6 KB, MIME type: image/png)
This file was created using Wolfram Mathematica 7 with the following command:
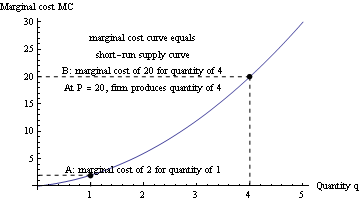
Plot[x (x + 1), {x, 0, 5},
 AxesLabel -> {"Quantity q", "Marginal cost MC"},
 AxesOrigin -> {0, 0},
 Epilog -> {PointSize[0.02], Point[{1, 2}], Point[{4, 20}], Black,
   Dashed, Line[{{1, 0}, {1, 2}}], Line[{{1, 2}, {0, 2}}],
   Line[{{4, 20}, {0, 20}}], Line[{{4, 20}, {4, 0}}],
   Text["A: marginal cost of 2 for quantity of 1", {2, 3}],
   Text["B: marginal cost of 20 for quantity of 4", {2, 21}],
   Text["marginal cost curve equals", {2, 27}],
   Text["short-run supply curve", {2, 24}],
   Text["At P = 20, firm produces quantity of 4", {2, 18}]}]
File history
Click on a date/time to view the file as it appeared at that time.
| Date/Time | Thumbnail | Dimensions | User | Comment | |
|---|---|---|---|---|---|
| current | 17:02, 28 May 2012 | | 360 × 201 (6 KB) | Vipul (talk | contribs) | |
| 22:31, 18 September 2010 | No thumbnail | 360 × 201 (6 KB) | Vipul (talk | contribs) | This file was created using [http://www.wolfram.com/mathematica Wolfram Mathematica 7] with the following command: <pre>Plot[x (x + 1), {x, 0, 5}, AxesLabel -> {"Quantity q", "Marginal cost MC"}, AxesOrigin -> {0, 0}, Epilog -> {PointSize[0.02], Po |
You cannot overwrite this file.
File usage
The following 2 pages use this file: