File:Notaxvspretaxforquantityproportionalsalestax.png
No higher resolution available.
Notaxvspretaxforquantityproportionalsalestax.png (360 × 201 pixels, file size: 17 KB, MIME type: image/png)
Created using Wolfram Mathematica 8 with the code:
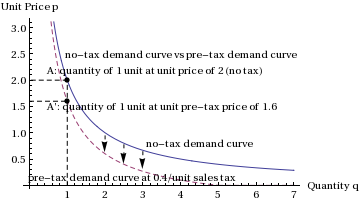
Plot[{2/x, Max[{(2/x) - 0.4, 0}]}, {x, 0.2, 7},
 AxesLabel -> {"Quantity q", "Unit Price p"}, AxesOrigin -> {0, 0},
 PlotStyle -> {Automatic, Dashed},
 Epilog -> {PointSize[0.02], Point[{1, 2}], Point[{1, 1.6}], Black,
   Dashed, Line[{{1, 0}, {1, 2}}], Line[{{1, 2}, {0, 2}}],
   Line[{{0, 1.6}, {1, 1.6}}], Arrow[{{2, 0.95}, {2, 0.62}}],
   Arrow[{{3, 0.65}, {3, 0.3}}], Arrow[{{2.5, 0.78}, {2.5, 0.4}}],
   Text["no-tax demand curve vs pre-tax demand curve", {4, 2.5}],
   Text["A: quantity of 1 unit at unit price of 2 (no tax)", {3.3,
     2.2}],
   Text["A': quantity of 1 unit at unit pre-tax price of 1.6", {3.5,
     1.5}],
   Text["no-tax demand curve", {4.5, 0.8}],
   Text["pre-tax demand curve at 0.4/unit sales tax", {2.7, 0.15}]}]
File history
Click on a date/time to view the file as it appeared at that time.
| Date/Time | Thumbnail | Dimensions | User | Comment | |
|---|---|---|---|---|---|
| current | 18:41, 21 December 2012 | | 360 × 201 (17 KB) | Vipul (talk | contribs) | Created using [http://mathematica.wolfram.com Wolfram Mathematica 8] with the code: <pre>Plot[{2/x, Max[{(2/x) - 0.4, 0}]}, {x, 0.2, 7}, AxesLabel -> {"Quantity q", "Unit Price p"}, AxesOrigin -> {0, 0}, PlotStyle -> {Automatic, Dashed}, Epilog ... |
You cannot overwrite this file.
File usage
The following 2 pages use this file: