File:Demandexpansionandmarketprice.png
No higher resolution available.
Demandexpansionandmarketprice.png (360 × 209 pixels, file size: 8 KB, MIME type: image/png)
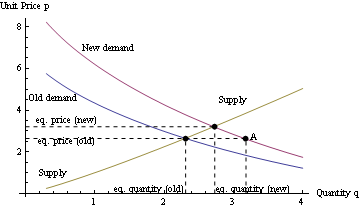
This file was created using Wolfram Mathematica 7 using the following command:
Plot[{7 (1 - (x/7)^(2/3))^(3/2), 10 (1 - (x/7)^(2/3))^(3/2),
  x^(7/6)}, {x, 0.3, 4}, AxesLabel -> {"Quantity q", "Unit Price p"},
 AxesOrigin -> {0, 0},
 Epilog -> {PointSize[0.02], Point[{2.31, 2.64}], Point[{2.73, 3.2}],
   Point[{3.18, 2.64}], Dashed, Black,
   Line[{{2.31, 0}, {2.31, 2.64}}], Line[{{0, 2.64}, {3.18, 2.64}}],
   Line[{{2.73, 0}, {2.73, 3.2}}], Line[{{3.18, 0}, {3.18, 2.64}}],
   Line[{{0, 3.2}, {2.73, 3.2}}], Text["eq. price (old)", {0.6, 2.5}],
    Text["eq. price (new)", {0.6, 3.5}],
   Text["eq. quantity (old)", {1.8, 0.2}],
   Text["eq. quantity (new)", {3.3, 0.2}],
   Text["Old demand", {0.4, 4.6}], Text["New demand", {1.2, 7}],
   Text["Supply", {0.4, 1}], Text["Supply", {3, 4.5}],
   Text["A", {3.3, 2.7}]}]
File history
Click on a date/time to view the file as it appeared at that time.
| Date/Time | Thumbnail | Dimensions | User | Comment | |
|---|---|---|---|---|---|
| current | 17:00, 28 May 2012 | | 360 × 209 (8 KB) | Vipul (talk | contribs) | |
| 14:56, 11 September 2010 | No thumbnail | 360 × 209 (8 KB) | Vipul (talk | contribs) | This file was created using [http://www.wolfram.com/mathematica Wolfram Mathematica 7] using the following command: <pre>Plot[{7 (1 - (x/7)^(2/3))^(3/2), 10 (1 - (x/7)^(2/3))^(3/2), x^(7/6)}, {x, 0.3, 4}, AxesLabel -> {"Quantity q", "Unit Price p"}, |
You cannot overwrite this file.
File usage
The following 4 pages use this file: